Collecting the results
The tests have ended and the report has been created ? Let’s take a look at it !
Results.html file
This is the main and the more explicit part of the results, it will give you all major information about the tests, plus some graphs to help you read the results.
A default result page looks like this :
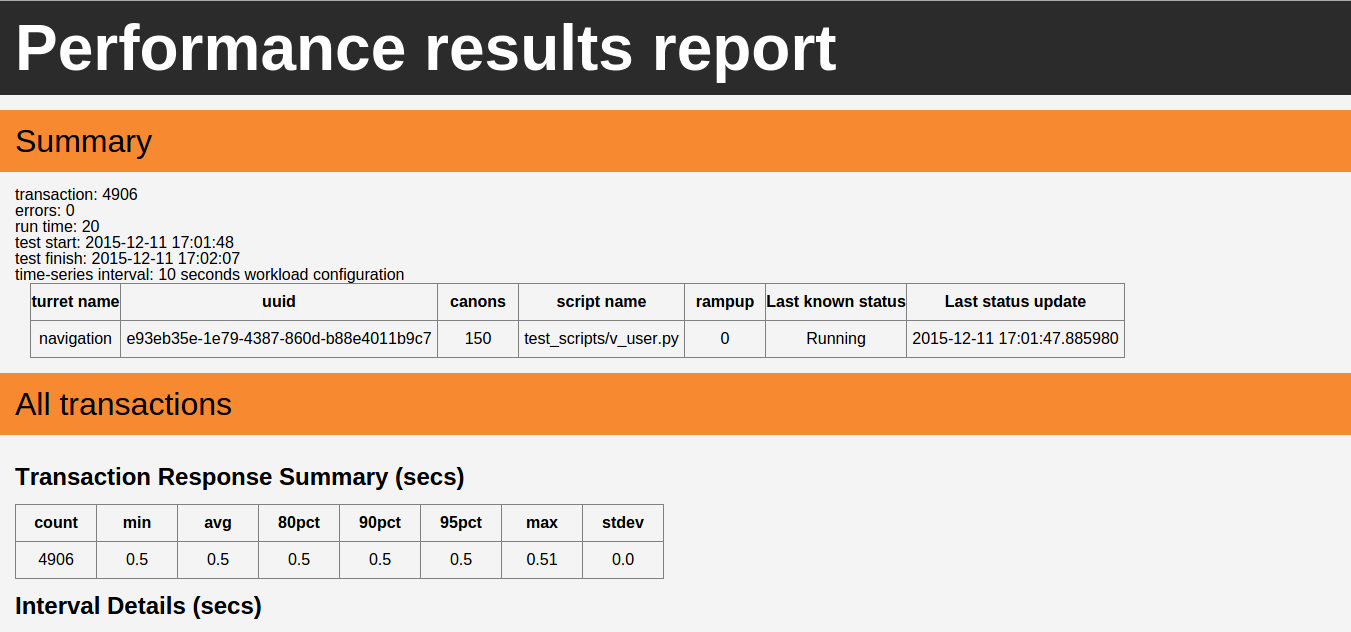
For each custom timer, a section will be created (like the “All transactions” section) and the associated graphs will be created.
The graphs are currently in SVG format and use javascript to make reading and interpretating the result easier.
Regenerate results
Sometimes you may need to regenerate the html report with all graphs from an sqlite file. OCT got a tool that allows you to do this.
You can simply use the oct rebuild-results like this for example:
oct rebuild-results . results.sqlite config.json
Note
The oct rebuild-results command will only work on an already created results folder that contains only the sqlite results and optionnaly the configuration.